


 ← Back to screener
 Lofty Secondary
755 Robinwood Dr, Florissant, MO 63033
🇺🇸 Florissant, MO
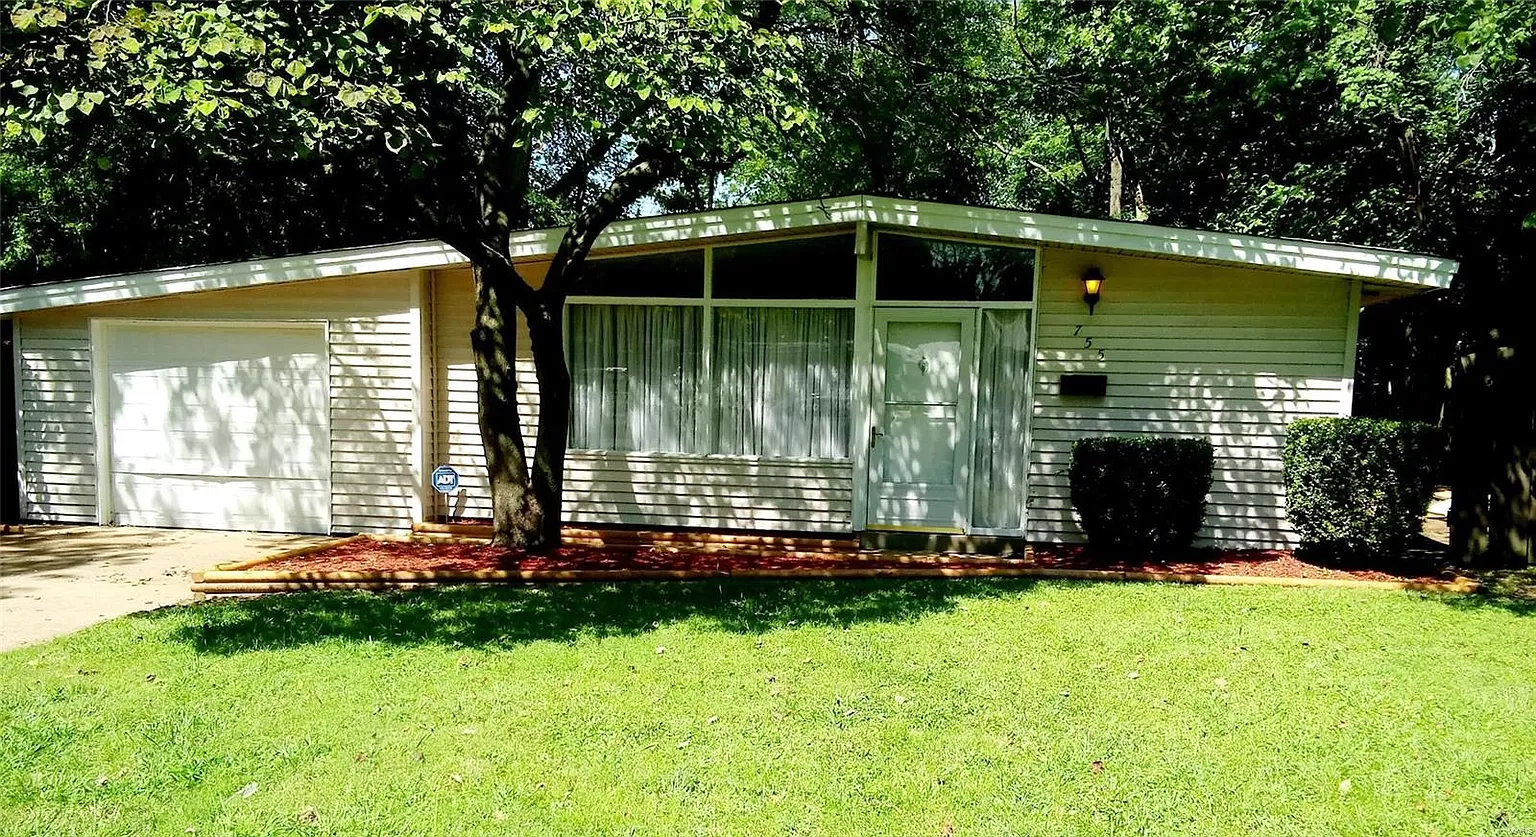
755 Robinwood Dr, Florissant, MO 63033 is a 3-bed, 1-bath single-family home, built in 1955. It was tokenized on Lofty in August 2022. The most recent trade, on Nov 6, 2026, filled at $15.16 a token, 68% below the $47.76 issue price. It carries a realized annual yield (ARY) of 4.8% on a monthly rent of $1,345, 19% below the ZIP code's typical rent of $1,656. Its tokens changed hands 4 times in the last 30 days ($108 in volume), and it has an Exit Score of 2 out of 100. 118 wallets hold the token; the largest holds 16.9% of the supply. Median household income in its census tract is $69,321, 15% below the county median. It sits outside FEMA's mapped flood hazard zones.
 1 / 12
Total Asset Value
$40,219
$126,716 raised
Price
$15.16 / token -41.5% vs previous fill
-68.3% vs issue price
Buy on Lofty ↗🕒 Realized yield · no payout 5 mo
4.77%
average of yield over time, to date
📈 Current Market Yield · no payout 5 mo
28.67%
No distribution for 5 months — this yield is what the listing would pay, not what it is paying.
⚠️ Risk signals
✕ 2 ! 2 ✓ 3
red = caution · click to inspect each signal
🔔 Watch this property
Get alerted when liquidity drops, a lawsuit is filed, or distributions stop.
Overview
4/5- Platform
- Lofty
- Token symbol
- Not provided
- Asset class
- Real estate
- Market
- Secondary
- Status
- Active
Exit & Liquidity
6/9- Sellability
- Two-sided
- Trades (7d)
- 0 fills
- AMM pool cash (USDC)
- $0.00
- AMM pool tokens
- 0
- Order book — buy
- 100
- Order book — sell
- 14
Executed trades
7 fillsActual fills on the secondary market, newest first — not open orders. Updated hourly; where a transaction hash exists the date links to the chain.
| When | Tokens | Price | Value |
|---|---|---|---|
| 11d ago | 2 | $15.16 | $30.32 |
| Oct 25, 2026 | 1 | $25.90 | $25.90 |
| Oct 23, 2026 | 1 | $25.89 | $25.89 |
| Oct 23, 2026 | 1 | $25.89 | $25.89 |
| Oct 3, 2026 | 2 | $5.00 | $10.00 |
| Oct 3, 2026 | 1 | $10.00 | $10.00 |
| Oct 3, 2026 | 2 | $12.50 | $25.00 |
Returns
7/11- Net APY
- 9.10%
- Gross APY
- 9.10%
- Realized ARY
- 4.77%
- Cash-on-cash
- 9.10%
- Gross rent / yr
- $16,140.00
- Monthly rent
- $1,345.00
- Total rent paid
- Not provided
- Payout cadence
- Monthly
Net yield over time
Operating costs (annual) — the drag from gross rent to NOI
| Property tax | $2,022.96 | 12.53% |
| Insurance | $1,146.12 | 7.10% |
| Management | $1,614.00 | 10.00% |
| Maintenance reserve | $5,950.00 | 36.86% |
| LLC admin | $750.00 | 4.65% |
| Total operating costs | $11,483.08 | 71.15% |
| Gross rent → NOI | $16,140.00 → — |
How net yield is calculated
Tenants pay gross rent, but property management (~7%), insurance, property tax, maintenance and the platform fee come out before you’re paid. Net rent is what’s left to distribute — those costs fall on the investor, not the platform. The platform keeps only its listing/trading fee.
Valuation
13/17- Current price / token
- $15.16 · 2 tokens ($30.32) · 11d ago
- Appraisal NAV
- $47.76
- Premium / discount vs NAV
- -68.3%
- Underlying value
- $127,050.00
- Sale price
- $119,000.00
- ZIP home value (Zillow)
- $198,802.84
- This price vs ZIP
- -40.1%
- ZIP rent (Zillow)
- $1,656.47
- This rent vs ZIP
- -18.8%
- Median home value (ACS)
- $122,000.00
- Median rent (ACS)
- $1,333.00
- HUD fair market rent
- $1,610.00 (3BR · ZIP)
- Rent vs HUD FMR
- -16.5%
Risk
8/16- LTV
- Not provided
- Property price
- $119,000.00
- Occupancy
- Vacancy on record
- Vacancy rate (tract)
- 6.00%
- Vacancy rate (county)
- 6.90%
- Income vs county
- -14.8%
- Income trend
- +34.8%
- Population trend
- +9.2%
- County tax standing
- Not provided
- FEMA flood zone
- Outside mapped hazard zones
Whale concentration
Moderate- Holders (wallets)
- ≈ 118ⓘ
- Total tokens
- 2,660
- Top holder
- 16.92%
- Top 5
- 53.07%
- Top 10
- 70.00%
- Largest holding
- 449 tokens
- Effective holders
- 13.3
- HHI
- 753.4
- Holder 1
- $21.45K
- 16.92%
- Holder 2
- $19.06K
- 15.04%
- Holder 3
- $10.51K
- 8.29%
- Holder 4
- $9.55K
- 7.54%
- Holder 5
- $6.69K
- 5.28%
- Holder 6
- $5.25K
- 4.15%
- 93 smaller holders
- $15.76K
- 12.44%
Read live from Algorand: every holder's on-chain balance across 118 wallets (issuer/reserve excluded). Higher top-holder share means a single seller can move the price. The platform's own holder count can run slightly higher — it also counts owners pooled in its custodial wallet.
Property & Neighborhood
9/13- Address
- Not provided
- Location
- Florissant, MO
- Country
- United States
- Property type
- Single-family
- Beds / baths
- 3 Bed / 1 Bath
- Size
- 1,148 sqft
- Year built
- 1955
- Operating since
- 2022-08-26 (4y 2m in)
- Median income (tract)
- $69,321.00
- Population (tract)
- 7,376
Off-chain neighborhood data — US Census ACS 5-year (tract 211101) + Zillow ZIP indices, joined by geocoded address. Measured, not curated.
Legal & Compliance
5/9- Issuer
- Lofty AI, Inc. ↗
- Legal wrapper / SPV
- Per-property Delaware LLC — token = LLC membership interest.
- Jurisdiction
- Delaware, USA
- Network
- Algorand
- On-chain contract
- ASA 468433605