



In August we measured RealT three weeks after its voluntary-liquidation call. Then, the median token was trading at a fifth of its issue price. We said we would publish the same measurements again rather than edit that report. This is the second reading.
Every figure here is as of 10 November 2026, and none will be edited afterwards.
Thirteen cents on the dollar
| Price vs issue | 13% | median of 484 listings traded in October |
| Market value | $20.6M | −85% in 12 months, −28% since August |
| Volume, October | $7,019 | across 783 fills, about $9 each |
| Turnover, 90 days | 0.17% | 90-day volume / market value |
The usual complaint about RealT is that its tokens "sell for far less than their original value". The measurement is more precise than that. In October, the median RealT listing that traded changed hands at 12.6% of its issue price. Every one of the 484 listings that traded did so below half its issue price.
Most of those trades are small, so we checked whether tiny fills drag the median down. Dropping fills under $5 leaves it at 12%. Counting only fills of $20 or more leaves 51 listings, and their median is 20%. Larger trades clear somewhat higher, but they still clear at a fifth of issue.
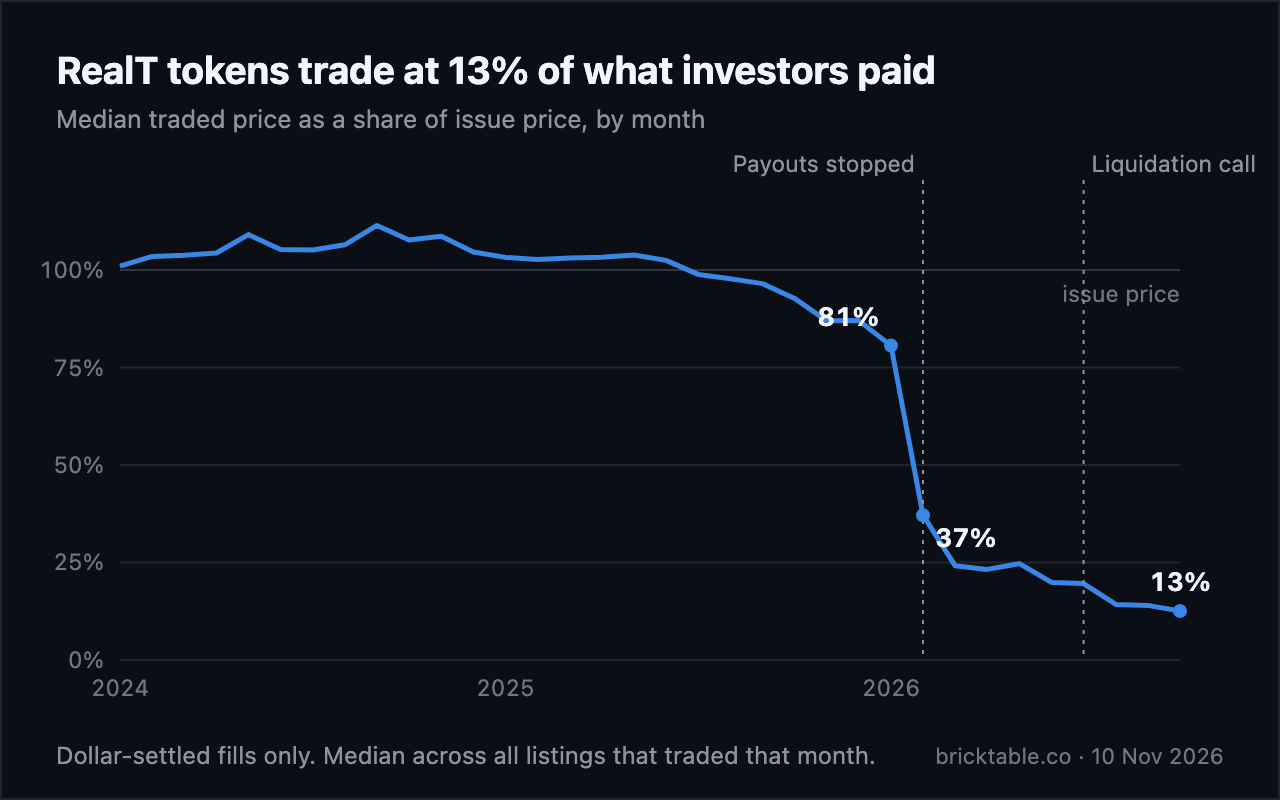
The decline was not gradual. Through 2024 and most of 2025, tokens traded at or slightly above issue. The slide started in mid-2025 and reached 81% by January 2026. Rental distributions stopped in February, and the median fell to 37% within that single month.
| Month | Price vs issue | Listings traded | Volume |
|---|---|---|---|
| Jan 2025 | 103% | 579 | $2,067,447 |
| Jan 2026 | 81% | 655 | $421,726 |
| Feb 2026 | 37% | 713 | $305,969 |
| Jul 2026 | 20% | 251 | $2,412 |
| Oct 2026 | 13% | 484 | $7,019 |
The July liquidation call barely registers on the price chart, because the market had already priced it in. The price did keep falling after the call: from 20% in July to 13% in October.
There is no exit at any size
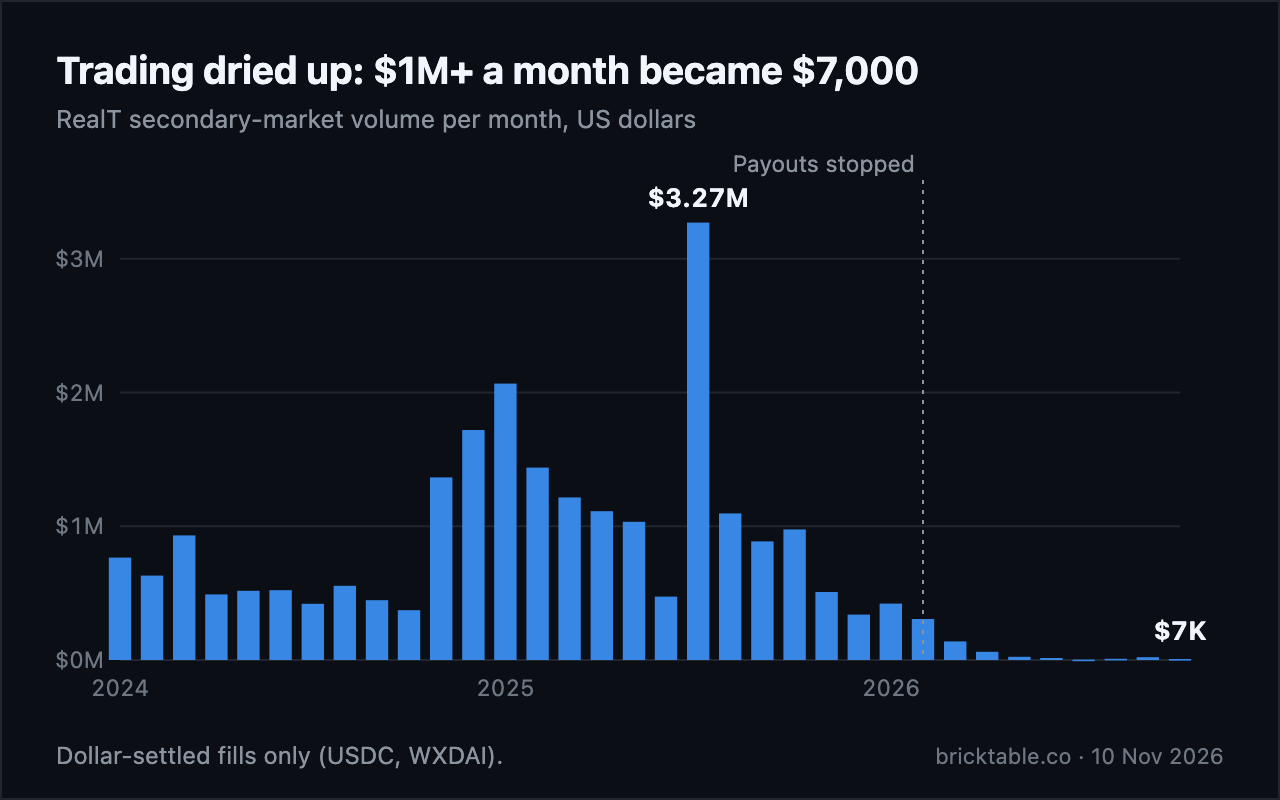
For most of 2025, a RealT holder could sell into a market that cleared about a million dollars a month. That market is gone. October's entire volume of $7,019 would buy about 0.03% of the catalogue at today's prices. The average fill was about nine dollars.
The 90-day volume, $35,473, is almost exactly what it was in the 90 days before, $36,820. That is not stabilisation. It is a floor of small trades that the rest of the catalogue cannot use.
For context, here is turnover on the other three platforms we track, measured the same way:
| Platform | 90-day volume | Market value | Turnover |
|---|---|---|---|
| Lofty | $1,742,927 | $29.3M | 5.9% |
| Binaryx | $64,211 | $4.3M | 1.5% |
| Reental | $461,271 | $117.8M | 0.39% |
| RealT | $35,473 | $20.6M | 0.17% |
Lofty is the closest comparison: US single-family rentals, sold as tokens, with a secondary market. In October its median traded listing changed hands at 77% of issue. Tokenized rentals did not all go to thirteen cents. RealT did.
What we are watching next
- Whether the court-appointed fiduciary approves property sales, and at what prices relative to the token valuations.
- Whether any formal liquidation filing appears. As of this writing we have not confirmed one.
- Whether token prices move toward whatever those sales imply. A sale at a known price is the first hard anchor this market has had since February.
We will publish these measurements again rather than edit this report.
Method
Prices are executed secondary-market fills, settled in dollar stablecoins (USDC and WXDAI). We exclude fills settled in lending receipts or other tokens. For each listing and month we take the volume-weighted average price and divide it by that listing's issue price. The figure reported is the median across the listings that traded that month, so a month with few trades rests on fewer listings; we state the count. Market value is outstanding tokens times the last traded price, and it is calculated the same way on all four platforms. Monthly volume sums those same fills. The 90-day figures come from our site-wide volume series, which excludes fills under one dollar.
The full trade-level data is available for academic research on request.
Nothing here is investment advice. We do not claim that RealT is bankrupt, that it is in a legal liquidation proceeding, or that any party acted unlawfully.